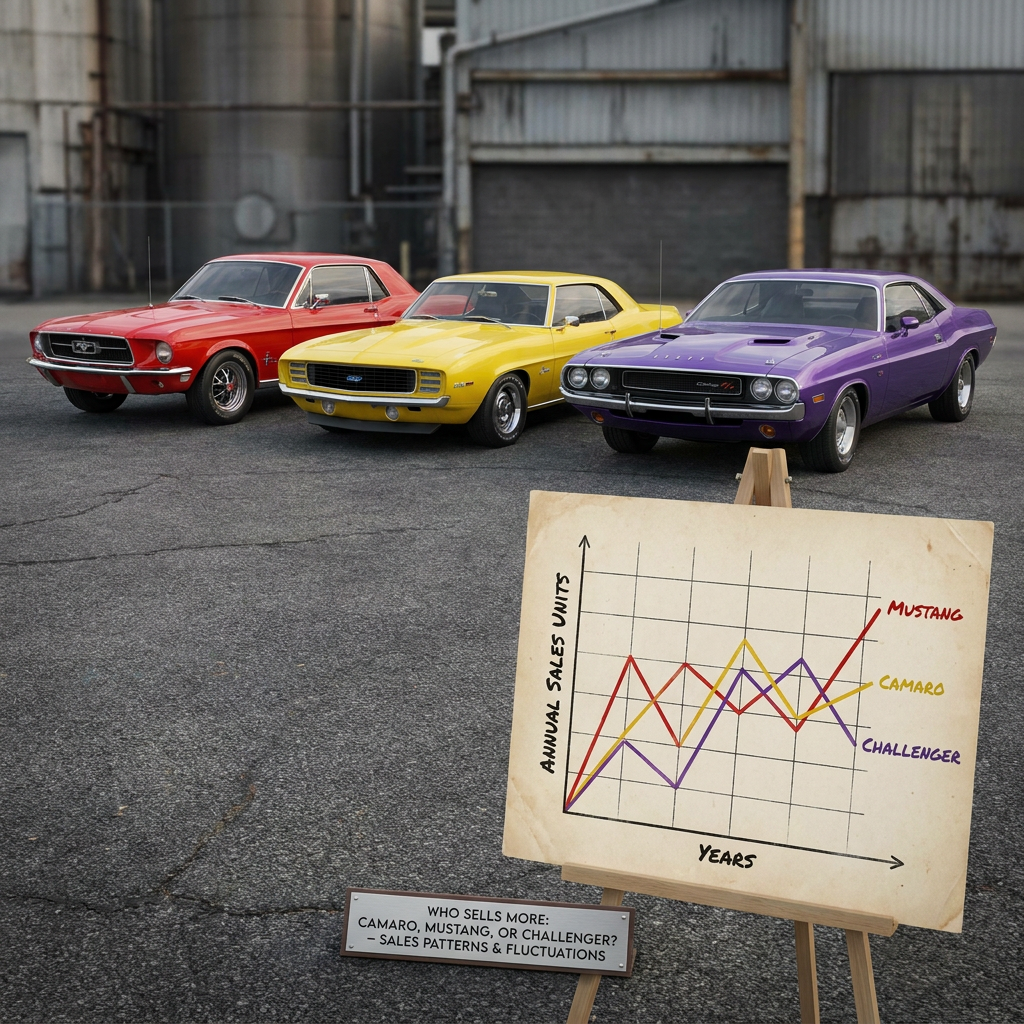
Camaro vs Mustang vs Challenger sales shifts by year and context—product cycles, incentives, and availability often matter more than a single “winner.
Who sells more: Camaro, Mustang, or Challenger?
Looking at annual sales, there isn’t a stable long-term “dominant” model: leadership swings and, in some years, it’s more accurate to ask “who fell less” than who won. Mustang tends to benefit right after a refresh or when the dealer network pushes steady volume; Challenger has often leveraged a long run of product continuity and a more “muscular” positioning that attracts a different audience; Camaro has been more sensitive to lineup changes and availability. The most useful read isn’t a single number, but the pattern: post-launch spikes, end-of-cycle dips, and distortions driven by production and trim mix.
To avoid being misled by charts shared on forums, set three guardrails: are we talking U.S. market or global; calendar years or model years; and are the figures manufacturer-reported sales or registrations. When those three aren’t aligned, the “Camaro vs Mustang vs Challenger sales” comparison quickly turns into a sterile argument.
Three quick checks before trusting a number:
- Verify whether the total includes fleets or only retail customers.
- Check whether the year covers a full 12 months or periods with production stoppages.
- Understand whether the number refers to the specific model or the broader family/line.
What you’re really comparing when people say “sales”
The word “sales” sounds simple, but in American performance cars it’s slippery. Automakers often publish quarterly and calendar-year results: units sold into the channel, useful for direction, but not always comparable to registrations. Registrations can better reflect what actually ends up on the road, but they depend on how each state and database aggregates models.
Another factor that changes the picture is product cadence. With equal public interest, a freshly updated model tends to push more deliveries; an end-of-cycle car can remain desirable but “age” in the numbers because buyers delay. In the pony-car segment this is even more pronounced: the pool is relatively small and reacts strongly to styling updates, infotainment, performance packages, and perceived value.
There’s also a less-discussed distortion: how the market interprets trims. Searches like “Camaro V6 vs Mustang V6 vs Challenger V6” often come from a practical doubt: how much does the entry price shape total volume? If a lineup keeps an appealing, available base version, it can sustain volume even when halo trims do the image work. If the offer shifts toward pricier trims, sales can drop without the car losing appeal; the reachable audience simply changes.
Finally, a practical reminder: sales don’t measure “how good” a car is. They measure how much demand turned into deliveries under real constraints (production, logistics, incentives, industrial priorities). That’s why a sales chart alone shouldn’t be used to conclude one of the three is “the best choice.”
Why the numbers swing: product cycle, incentives, availability
The boring explanation is often the true one: volume follows the ability to deliver and the perceived deal at the exact moment a buyer walks into a dealership. A period of high demand may not translate into sales if lead times stretch or key trims can’t be ordered. Conversely, a model with lukewarm demand can “rise” in the counts thanks to abundant stock and aggressive promotions.
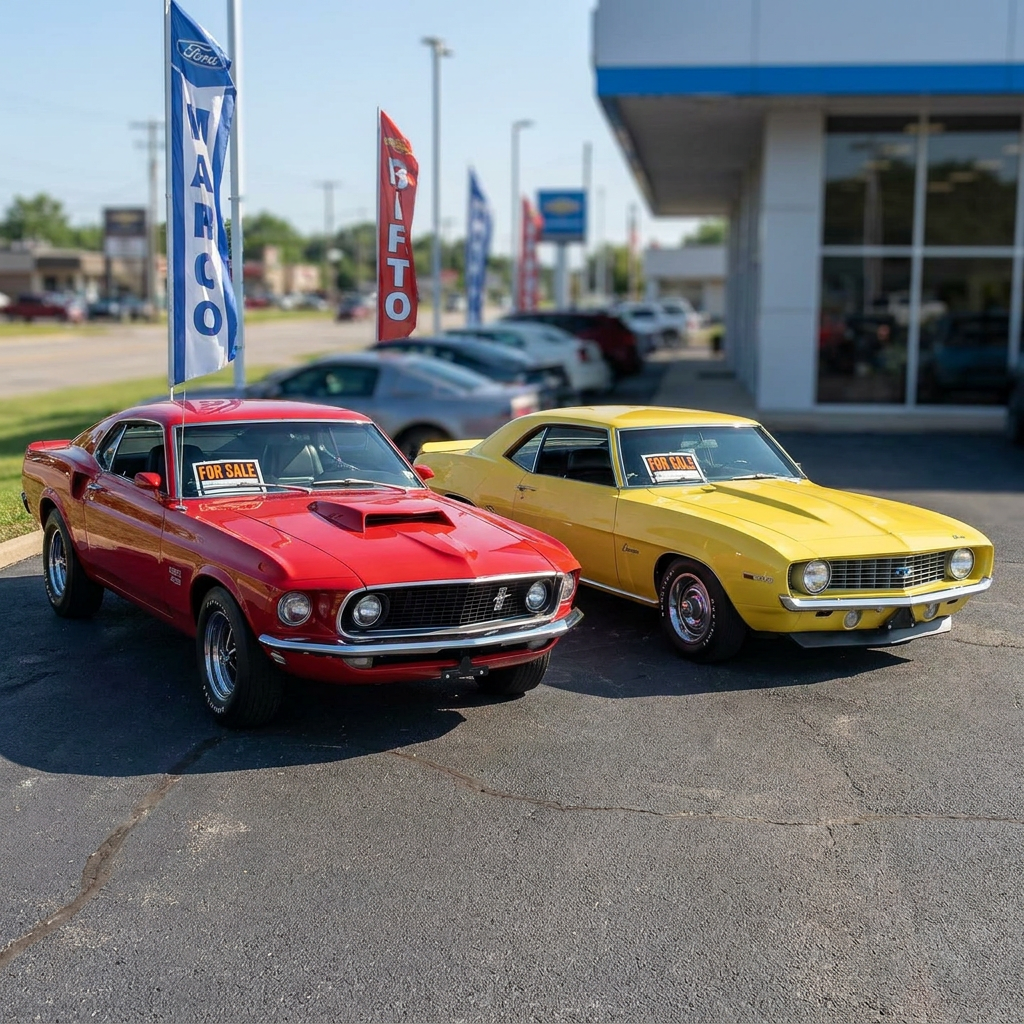
In “Mustang x Camaro vs Challenger,” positioning also affects volume stability. Mustang and Camaro have historically been read as more direct rivals, with buyers cross-shopping style, dynamics, and sporty image in comparable ways. Challenger has played the size and road-presence card more openly. That’s not a value judgment; it means that, in some years, Challenger may pull buyers not so much from Mustang or Camaro, but from other performance coupes or sedans—making three-way comparisons less linear.
Some signals that almost always foreshadow a change in annual sales:
- End-of-cycle with minor updates: more “waiting” than immediate purchases.
- Trim cuts or simplification: fewer available combinations, fewer deals closed.
- Incentives and financing: they change who can afford the car.
- Supply issues: a single component can reduce production capacity.
When reading historical charts, avoid a common mistake: attributing every dip to “lack of interest.” Sometimes the dip is an industrial choice. If a brand must allocate capacity to more profitable or strategic models, a sports coupe can be penalized in the numbers while remaining iconic.
One last note on more spec-sheet-style comparisons like “Camaro vs Mustang vs Challenger V8,” “Camaro vs Mustang vs Challenger weight,” or “Camaro vs Mustang vs Challenger gas mileage.” These differences matter to many people, but they influence sales indirectly: not because everyone runs technical calculations, but because price, insurance, fuel costs, and perceived taxes create a psychological threshold. Below it, people buy; above it, they delay or switch segments.
How to read a year-by-year comparison without getting fooled by details (12 months, quarters, small gaps)
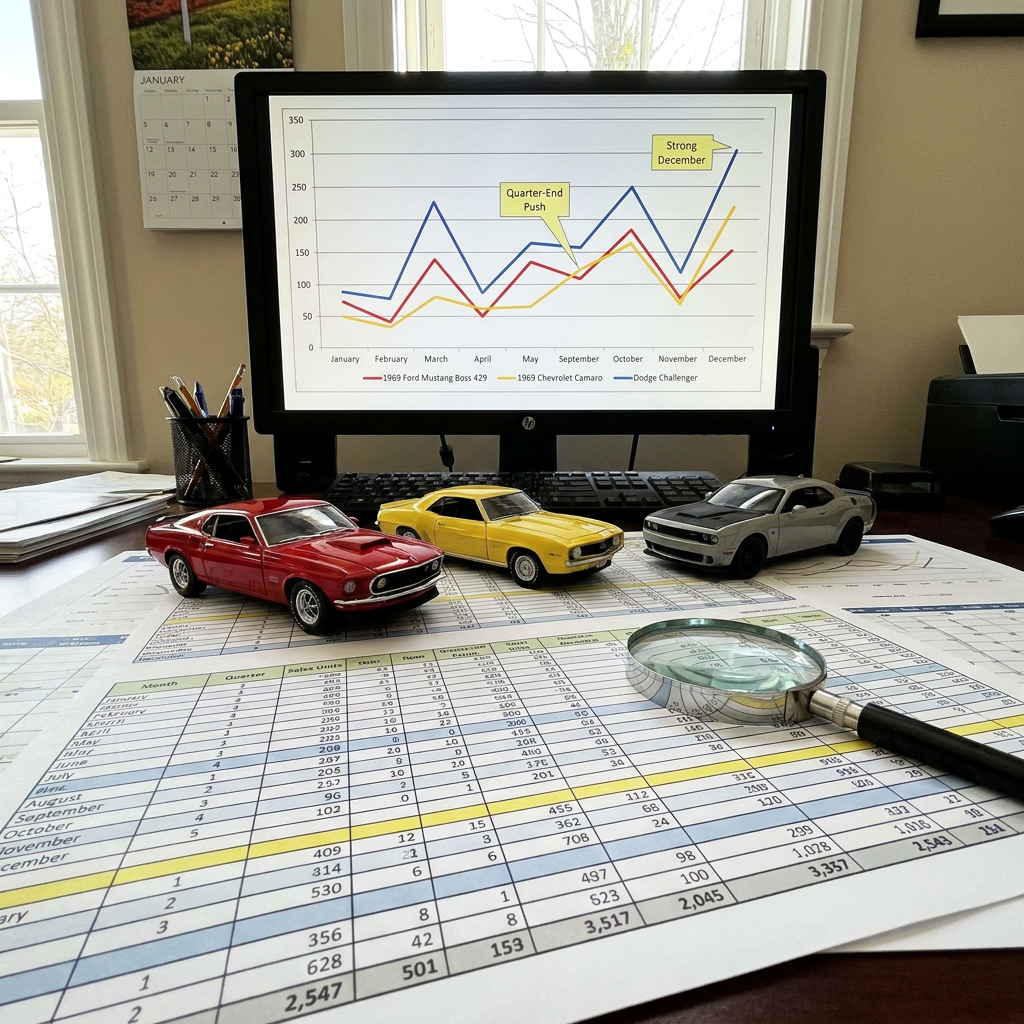
When you revisit charts and tables for Camaro vs Mustang vs Challenger sales, the first trap isn’t “who’s ahead,” but how much they’re ahead. In a segment with relatively modest volumes, a gap of a few thousand units can come down to how strong months fell, how many deliveries slipped between December and January, and how automakers pushed inventory at quarter-end.
A practical approach is to look at the percentage difference, not just units. When the gap between two models is small, the “X won” interpretation is fragile: one quarter of accelerated or delayed deliveries can flip the year. If the gap is clearly larger and repeats with some consistency, it’s more reasonable to talk about a real advantage—while still asking why it formed.
The second point is the shape of the data. Quarterly reports can show an “overtake” that fades on the annual total. The opposite happens too: a model starts slow and recovers when specific trims arrive or availability normalizes. In practice, a more robust read takes two steps:
- Check whether the model had a spike concentrated in 1–2 quarters (a sign of a commercial push or backlog catch-up) or kept a steady pace.
- Verify whether the year is “clean” or includes abnormal periods: production stoppages, trim changes, model-year transitions.
A third detail, often underestimated, is the “year-end” effect: many brands try to close the fiscal year with higher numbers, which can shift deliveries and registrations. If a chart shows a sharp year-end jump, treat it as a channel-management signal, not automatically as organic demand growth.
This lens also helps frame related searches like “Camaro vs Mustang vs Challenger gas mileage” or “Camaro vs Mustang vs Challenger weight.” Fuel economy and mass matter, but they rarely explain a year-to-year flip by themselves; more often they work through perceived running costs and insurance—so the effect is gradual, not sudden.
Why sources don’t match: definitions, audits, and data-collection methods
The hottest arguments around Camaro vs Mustang vs Challenger sales usually start when two “authoritative” sources show different numbers. It’s not always bad faith; it’s often methodology. In automotive reporting, manufacturers communicate sales and deliveries using internal criteria, while registrations come from administrative databases. They overlap, but they don’t always match.
To separate a normal mismatch from a suspicious one, you need a verifiable yardstick. In some channels, U.S. automakers publish data following logic consistent with corporate reporting and investor communications. That can reduce the risk of “creative” numbers, but the definition problem remains: what’s counted, and when.
For an institutional reference on the perimeter of corporate disclosures, the SEC’s page on periodic reporting can be a useful anchor, explaining filing logic and disclosure responsibilities (SEC guide to periodic reporting). It’s not a model-by-model sales source, but it’s a concrete reminder: depending on the channel, the purpose of the data changes—and so does its form.
In practice, when two tables don’t match, the questions that separate a serious comparison from a forum one are very specific:
- Is the figure “sold to the end customer” or “sold into the channel” (and therefore potentially sitting in inventory)?
- Is the geographic scope identical (entire U.S., individual states, or different aggregations)?
- Are special editions or sub-variants summed the same way, or does one source attribute them differently?
If one source uses registrations and another uses manufacturer-reported sales, some gap is normal. The comparison remains useful, but treat it as a trend indicator—not an absolute truth about “how many are on the road.”
The role of engine and trim mix: why V6 and V8 shift volume differently
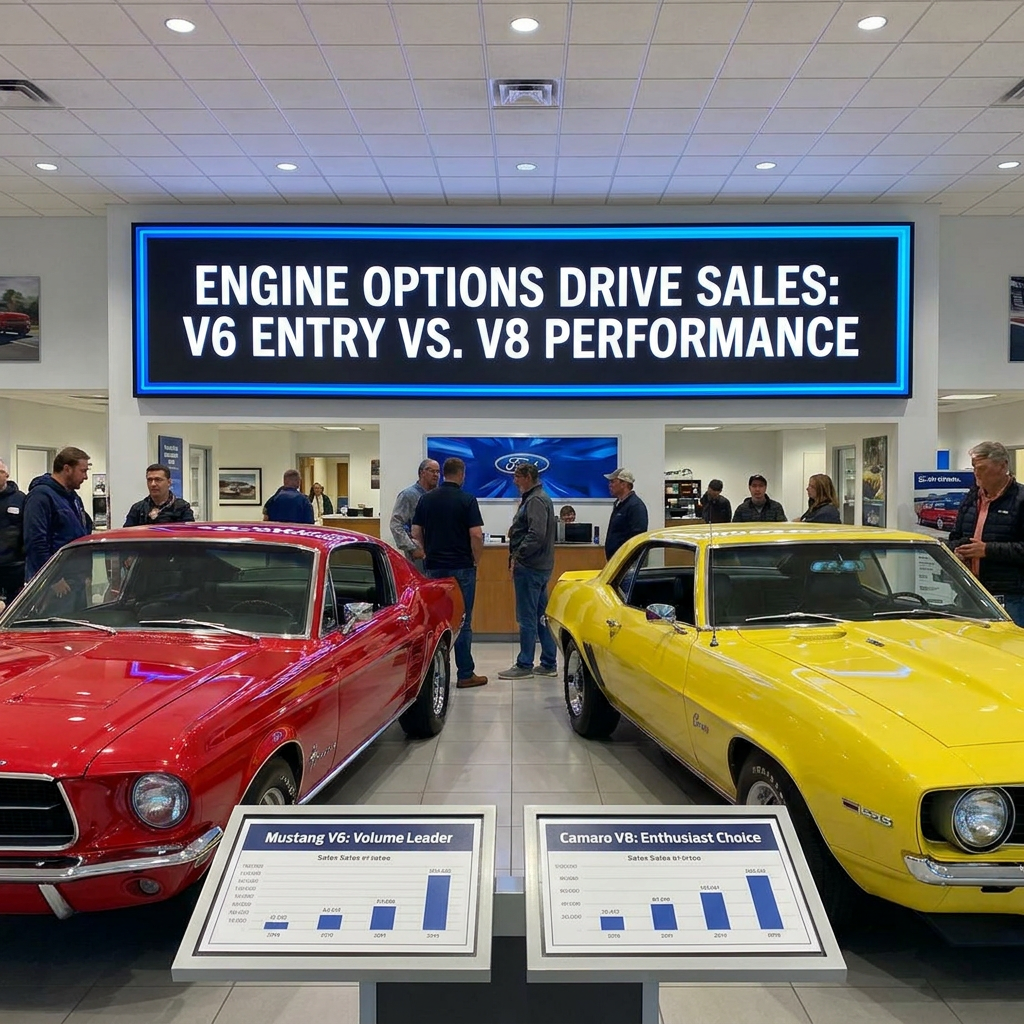
Many searches start from a seemingly technical question (“Camaro V6 vs Mustang V6 vs Challenger V6,” or “Camaro vs Mustang vs Challenger V8”), but the real consequence is commercial: the lineup mix determines the size of the buyer pool. A model with a more accessible, available entry point can sustain steadier numbers; one that pushes buyers toward pricier trims can lose volume even if it remains highly desired.
You don’t need a spec-sheet war here. You need to understand three mechanisms that change annual sales:
- Psychological price threshold: when the trim “you can actually find” crosses a certain threshold, part of the audience exits the market or delays. It’s not a judgment on value; it’s demand dynamics.
- Availability of key trims: if entry trims or the most wanted versions have long lead times, annual volume can shift toward whoever delivers sooner, even with similar interest.
- Halo effect: top trims (often V8s and performance packages) can drive attention and reputation, but don’t always drive units. Sometimes they support margins and perception more than volume.
The result is that a year showing a dip doesn’t automatically imply a “cultural” decline of the model. It may be a year when the lineup moved upmarket, or when real-world availability favored a rival. In Camaro vs Mustang vs Challenger sales, this is one of the few keys that explains why volume can change without a true shift in public taste.
This also intersects with fuel economy and running costs (“Camaro vs Mustang vs Challenger gas mileage”), but the effect is more indirect: it’s less about the consumption figure itself and more about perceived total cost (fuel, insurance, local taxes) narrowing or widening the potential audience for higher-output trims.
When sales stop measuring demand: transitions, end-of-run, and the “waiting effect”
There are phases when Camaro vs Mustang vs Challenger sales stops being a reliable measure of demand and becomes a measure of transition. It’s typical when a model nears the end of production, changes platform, or enters a brand repositioning phase. At that point, buyers can behave non-linearly: some buy immediately “before it ends,” others wait for what’s next, and others leave the segment.
This creates a practical phenomenon: the “waiting effect.” In certain phases, volume can fall even if interest stays high, simply because more informed buyers delay. If the transition comes with uneven availability, the numbers become even harder to interpret: fewer deliveries doesn’t mean fewer interested people; it means more friction between intent and delivery.
In this phase, some reads become more useful than the annual total:
- Quarter-to-quarter stability or instability (a prolonged “gap” is often a production/order constraint, not a lack of customers).
- Peaks tied to final trims or special editions, which can shift deliveries into specific periods.
- How the public talks about the model: more “last chance” or “I’m waiting for the next one” chatter signals demand that isn’t converting immediately.
This is also where “entertainment” comparisons (for example, curiosity about a “Top Gear Camaro vs Mustang vs Challenger episode”) influence perception more than the count. They can raise attention, but they don’t solve the bottlenecks that determine deliveries.
During a transition, the right question isn’t “who sold more,” but “what is that number measuring in that year”: delivery capacity, channel cleanup, or a market that’s waiting. That distinction completely changes how you read a historical chart—and prevents turning an end-of-run phase into a final verdict on the model’s value.
What sales mean in practice for someone choosing among the three

In Camaro vs Mustang vs Challenger sales, the most useful takeaway isn’t the raw ranking, but what volume suggests about three concrete things: ecosystem, used-market liquidity, and continuity of support. A model that keeps steady volume tends to have more in-stock choice, more parts circulating, and a larger community; it’s not a law, but it shows up over time when you’re hunting components, shops that know the platform well, or proven aftermarket solutions. If volume becomes intermittent, real-world availability can come in “waves”: periods with lots of supply and periods where you pay more to get the right example.
This is also where many online debates get confused: the annual total gets used like a quality report card. In reality, a dip can mean many things unrelated to engineering merit: industrial priorities, transitions, capacity allocation, or a lineup that moved away from “mass” trims. The effect still shows up in the market, though: when a model sells less, it often becomes harder to estimate future value from past comps alone, because comparables shrink and prices can move less predictably.
To turn the comparison into a sensible decision, tie the number to an operational question: “How much do I need the car to be easy to buy and resell?” If you plan to switch often, stable supply and demand matters almost as much as personal preference. If it’s a long-term project, continuity of support and cost predictability matter more; here, the difference isn’t a single “winning” year, but the multi-year trajectory and the strength of the ecosystem.
One firm point, without romanticism: using annual sales as an identity argument (“mine is superior because it sells more”) is a dead end. The data helps measure friction and accessibility, not technical or cultural hierarchy. If you want a criterion that holds up outside forums, it’s this: sales help you predict how easy it will be to live with the car in the real world—not how fun it will be to drive.
Camaro vs Mustang vs Challenger sales: turning numbers into a choice without chasing a winner

If you want a three-way comparison that doesn’t end in tribalism, accept one thing: Camaro, Mustang, and Challenger don’t always compete on the same ground, and their volumes reflect partially different audiences. That’s why forcing a single “champion” doesn’t make sense. Instead, use the numbers to choose the type of experience and the amount of compromise you’re willing to absorb on buying, ownership, and resale.
A quick grid—more useful than a hundred charts—is to think in scenarios. It’s not a ranking; it’s a way to avoid being dragged by one unusually good or bad year.
| Situation | Which of the three tends to fit better | Why sales matter here |
|---|---|---|
| You want maximum ease finding the right example and reselling without long wait times | Whichever has the most consistent volume in the period you’re considering | More real supply, more comparables, fewer price swings tied to temporary scarcity |
| You want a bold image and big road presence, even at the cost of fuel use and size | Challenger (when the market treats it as a distinct option) | Demand can stay supported even if the direct comparison with the other two is less linear |
| You want the most direct rivalry and the most “like-for-like” comparison over time | Mustang and Camaro as the more comparable pair | Volume more often reflects product cycles and availability in a comparable way |
The decisive step is choosing a coherent time horizon. If you look at a single year, you’re exposed to distortions: quarter-end pushes, inventory, slipped deliveries. If you look at a wider window, the real profile emerges: how often one of the three enters a “gap” or contraction phase, and how quickly it recovers. That’s where the numbers become useful, because they measure the friction between desire and reality: orderability, lead times, availability of key trims.
A clear editorial stance based on how these markets work: the most common mistake is choosing against a model because it sold less in one year. If you truly like the car and plan to keep it, the weight of annual sales should drop—otherwise you end up buying what’s easiest short-term and regretting it every time you open the garage. Conversely, if the car is a planned rotation (a few years, then switch), ignoring the sales trajectory is a fast way to complicate resale.
Where this comparison really helps (and where it doesn’t)
This kind of comparison works well for people deciding under real constraints: purchase timing, the ability to change cars within 24–48 months, or the need to find a specific configuration without months of waiting. In those cases, Camaro vs Mustang vs Challenger sales becomes a pragmatic friction indicator: how likely you are to compromise on color, trim, or engine, and how easy it will be to exit the car without losing time and money.
It’s less suited to anyone looking for an “objective” answer on which is best. Sales don’t measure driving enjoyment, model identity, or fit with your taste. If the goal is to use numbers to justify a preference you already have, the comparison becomes noise: any year can be cherry-picked to confirm a thesis. In those cases, decide on personal criteria and concrete checks—not an annual total.
Frequently asked questions
Why does Camaro vs Mustang vs Challenger sales change so much year to year?
Because in a niche segment, a few practical factors can move volume: availability, inventory, incentives, and transition phases. With a relatively small buyer pool, even moderate gaps can flip the order without signaling a “cultural” shift in demand.
Is it fair to say “sells more” means “is better”?
No: sales measure how much demand becomes deliveries under real constraints, not overall quality. They can, however, hint at how easy it will be to find cars, parts, and a liquid used market.
How can you tell whether two sales tables are comparable?
Align three things: geographic scope, time period (calendar year or otherwise), and the definition of the data (reported sales vs registrations). If even one changes, the comparison can still be useful as a trend, but it loses precision as a “ranking.”
Do searches like “Camaro vs Mustang vs Challenger gas mileage” really explain sales?
They matter more as perceived cost than as an isolated technical number: fuel, insurance, and taxes can narrow the buyer pool, especially for higher-output trims. But they rarely explain a clean annual overtake without availability and lineup factors too.
Three things worth keeping in mind
In Camaro vs Mustang vs Challenger sales, the useful question isn’t “who wins,” but “what is that number measuring in that year?”
Sales are a good indicator of accessibility and used-market liquidity, not a quality score or a measure of driving enjoyment.
If your ownership horizon is short, volume trajectory matters a lot; if it’s long, personal fit and ecosystem strength matter more.